Call Statistics
You may see the aggregate graphical data of calls to your company in the report of calls.
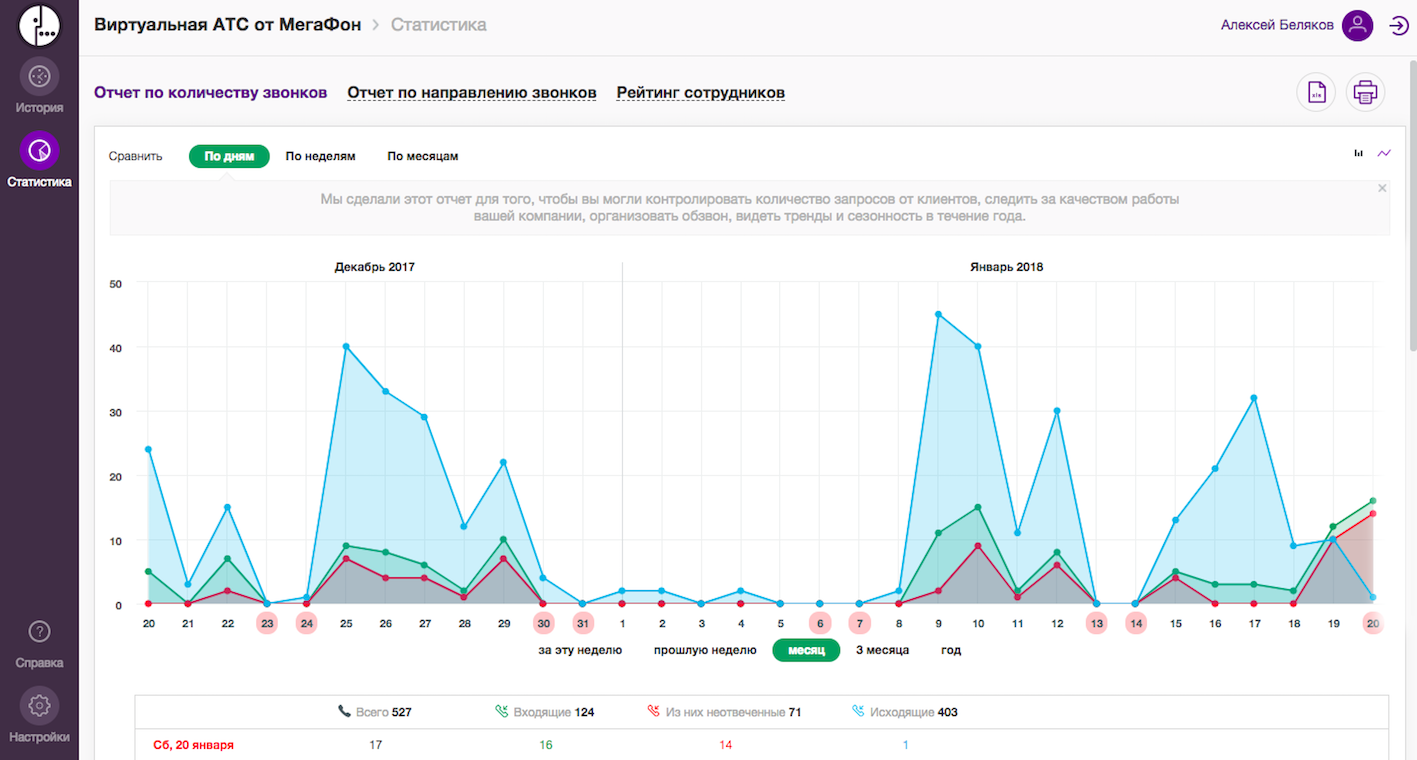
You may select the calls for a certain period, divide data by day, week or month, as well as a different representation of statistics. It may be shown as a bar graph or a conventional linear graph. You may click on any column or point of the chart and get the call history for the selected period. You may see that on January 20 there were 14 missed calls in the example. Click on the point of the schedule of missed calls. The system will open the «History» section, sort the calls by date and by missed calls for this period. You will see all the clients who could not reach you on January 20.
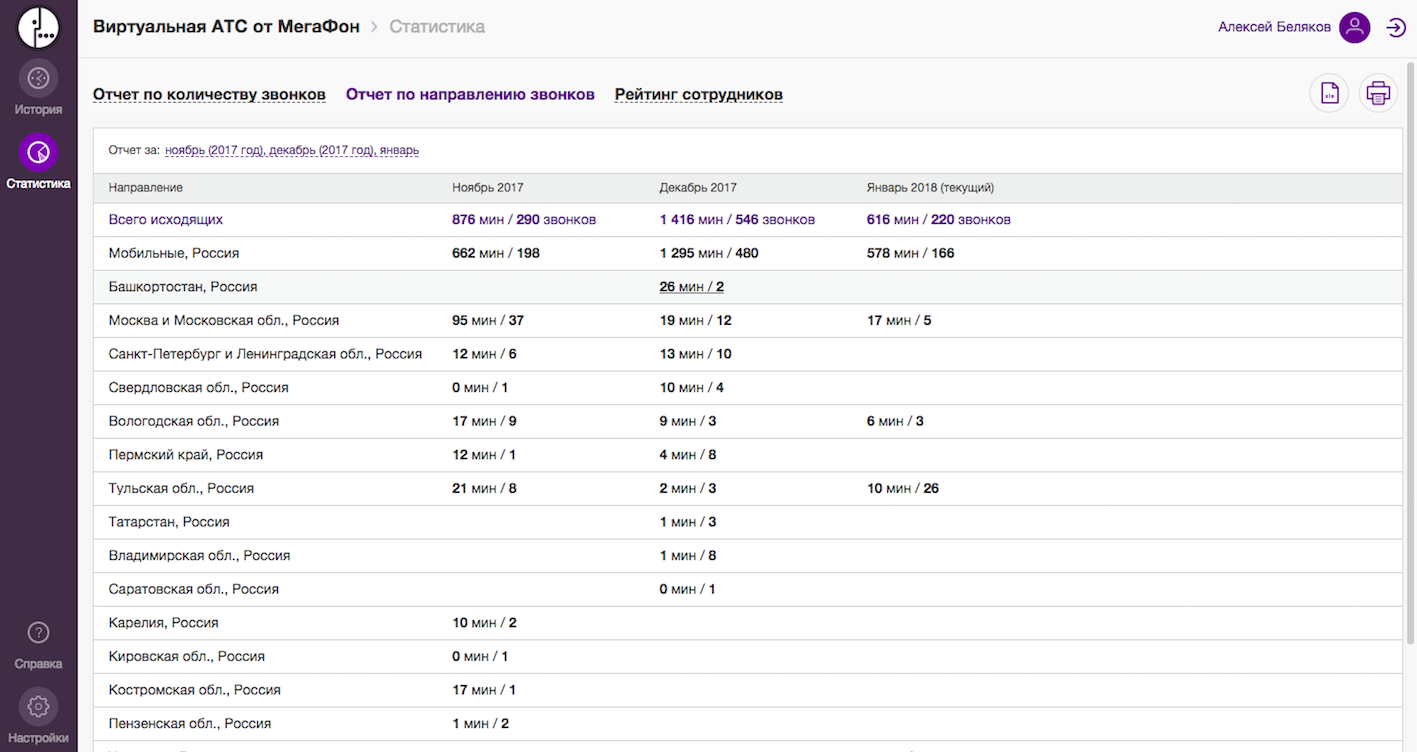
The report on the directions allows you to see where your employees often call.
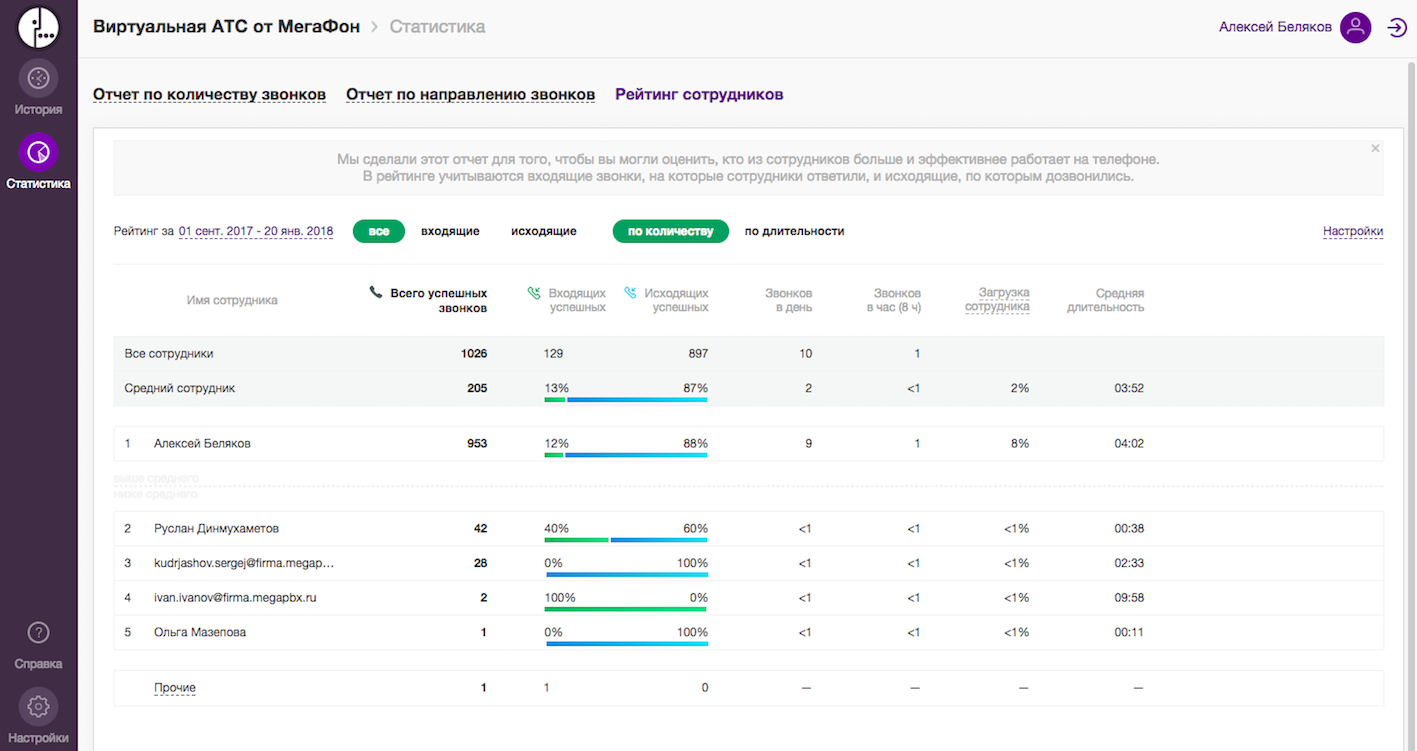
The Employee Rating report allows you to evaluate the performance of your company's employees. The report calculates the average performance indicators for the company and provides the information on the performance of each employee, and arrange them in order of efficiency, above or below the company's average.
You may choose one of 2 working time modes in the report settings. The mode is given on the basis of a type of calculation performed:
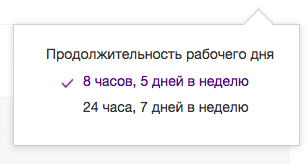
More flexible schedule modes will be available in the near future.